Klin Onkol 2021; 34(3): 220-234. DOI: 10.48095/ccko2021220.
Background: Radiation therapy plays a leading role in the treatment of prostate cancer, but the emergence of radioresistant forms of this disease dictates the need for a personalized approach based on the data from genetic and epigenetic markers. Such markers include the copy number variation as well as gene and microRNA expression. Purpose: The aim of the study was to validate the list of potential predictors of radioresistance of prostate tumor cells in a model experiment based on the determination of gene copy number variation, gene transcriptional activity and microRNA expression. Material and methods: The study used a PC-3 prostate cancer cell culture. The determination of the relative copy number variation and expression of 32 genes (BRCA1, BRCA2, PTEN, CASP3, CASP8, BAX, BCL2, CASP9, P53, MDM2, AKT1, ATM, BRIP1, CDK1, CDKN1B, CCND1, CCND3, FGFR2, KU70, RAD50, RAP80, Rif1, RNF168, TopBP1, HIST, H2AX, EXO1, XRCC4, RBBP8, EP300, LIG4, C-FLIP), as well as 15 microRNAs (let-7, miR15a/ 16, miR-17, miR-18a, miR-21, miR-24, miR-26b, miR-99a, miR-100, miR-101, miR-106a, miR-663a, miR-143, miR-145) was performed using the real-time quantitative polymerase chain reaction method. It was found that daily irradiation of PC-3 cells on a Novalis TX linear accelerator at doses of 6 and 7 Gy for 5 days leads to a significant decrease in the total number of cells and the number of viable cells. Nevertheless, after 5 days of irradiation, about 15% of the initial number of prostate tumor cells retained their viability, which is due to their special genetic and epigenetic characteristics: increased copy number and expression of genes BRCA2, CDK1, CDKN1B, H2AX, RAD50, XRCC4, RBBP8 and EP300 and reduced copy number and expression of CCND3, TP53, and BCL2 genes, as well as differential expression of six microRNAs (hsa-miR-18a-5p, hsa-miR-24-5p, hsa-miR-99a-5p, hsa-miR-100-5p, hsa-miR-145-5p, hsa-let-7a-3p). Conclusion: This study enabled to identify genetic and epigenetic markers of prostate tumor cells resistance to radiation therapy.
Fig. 3, 5, 6, 7 and 8 only at the online version of this article:
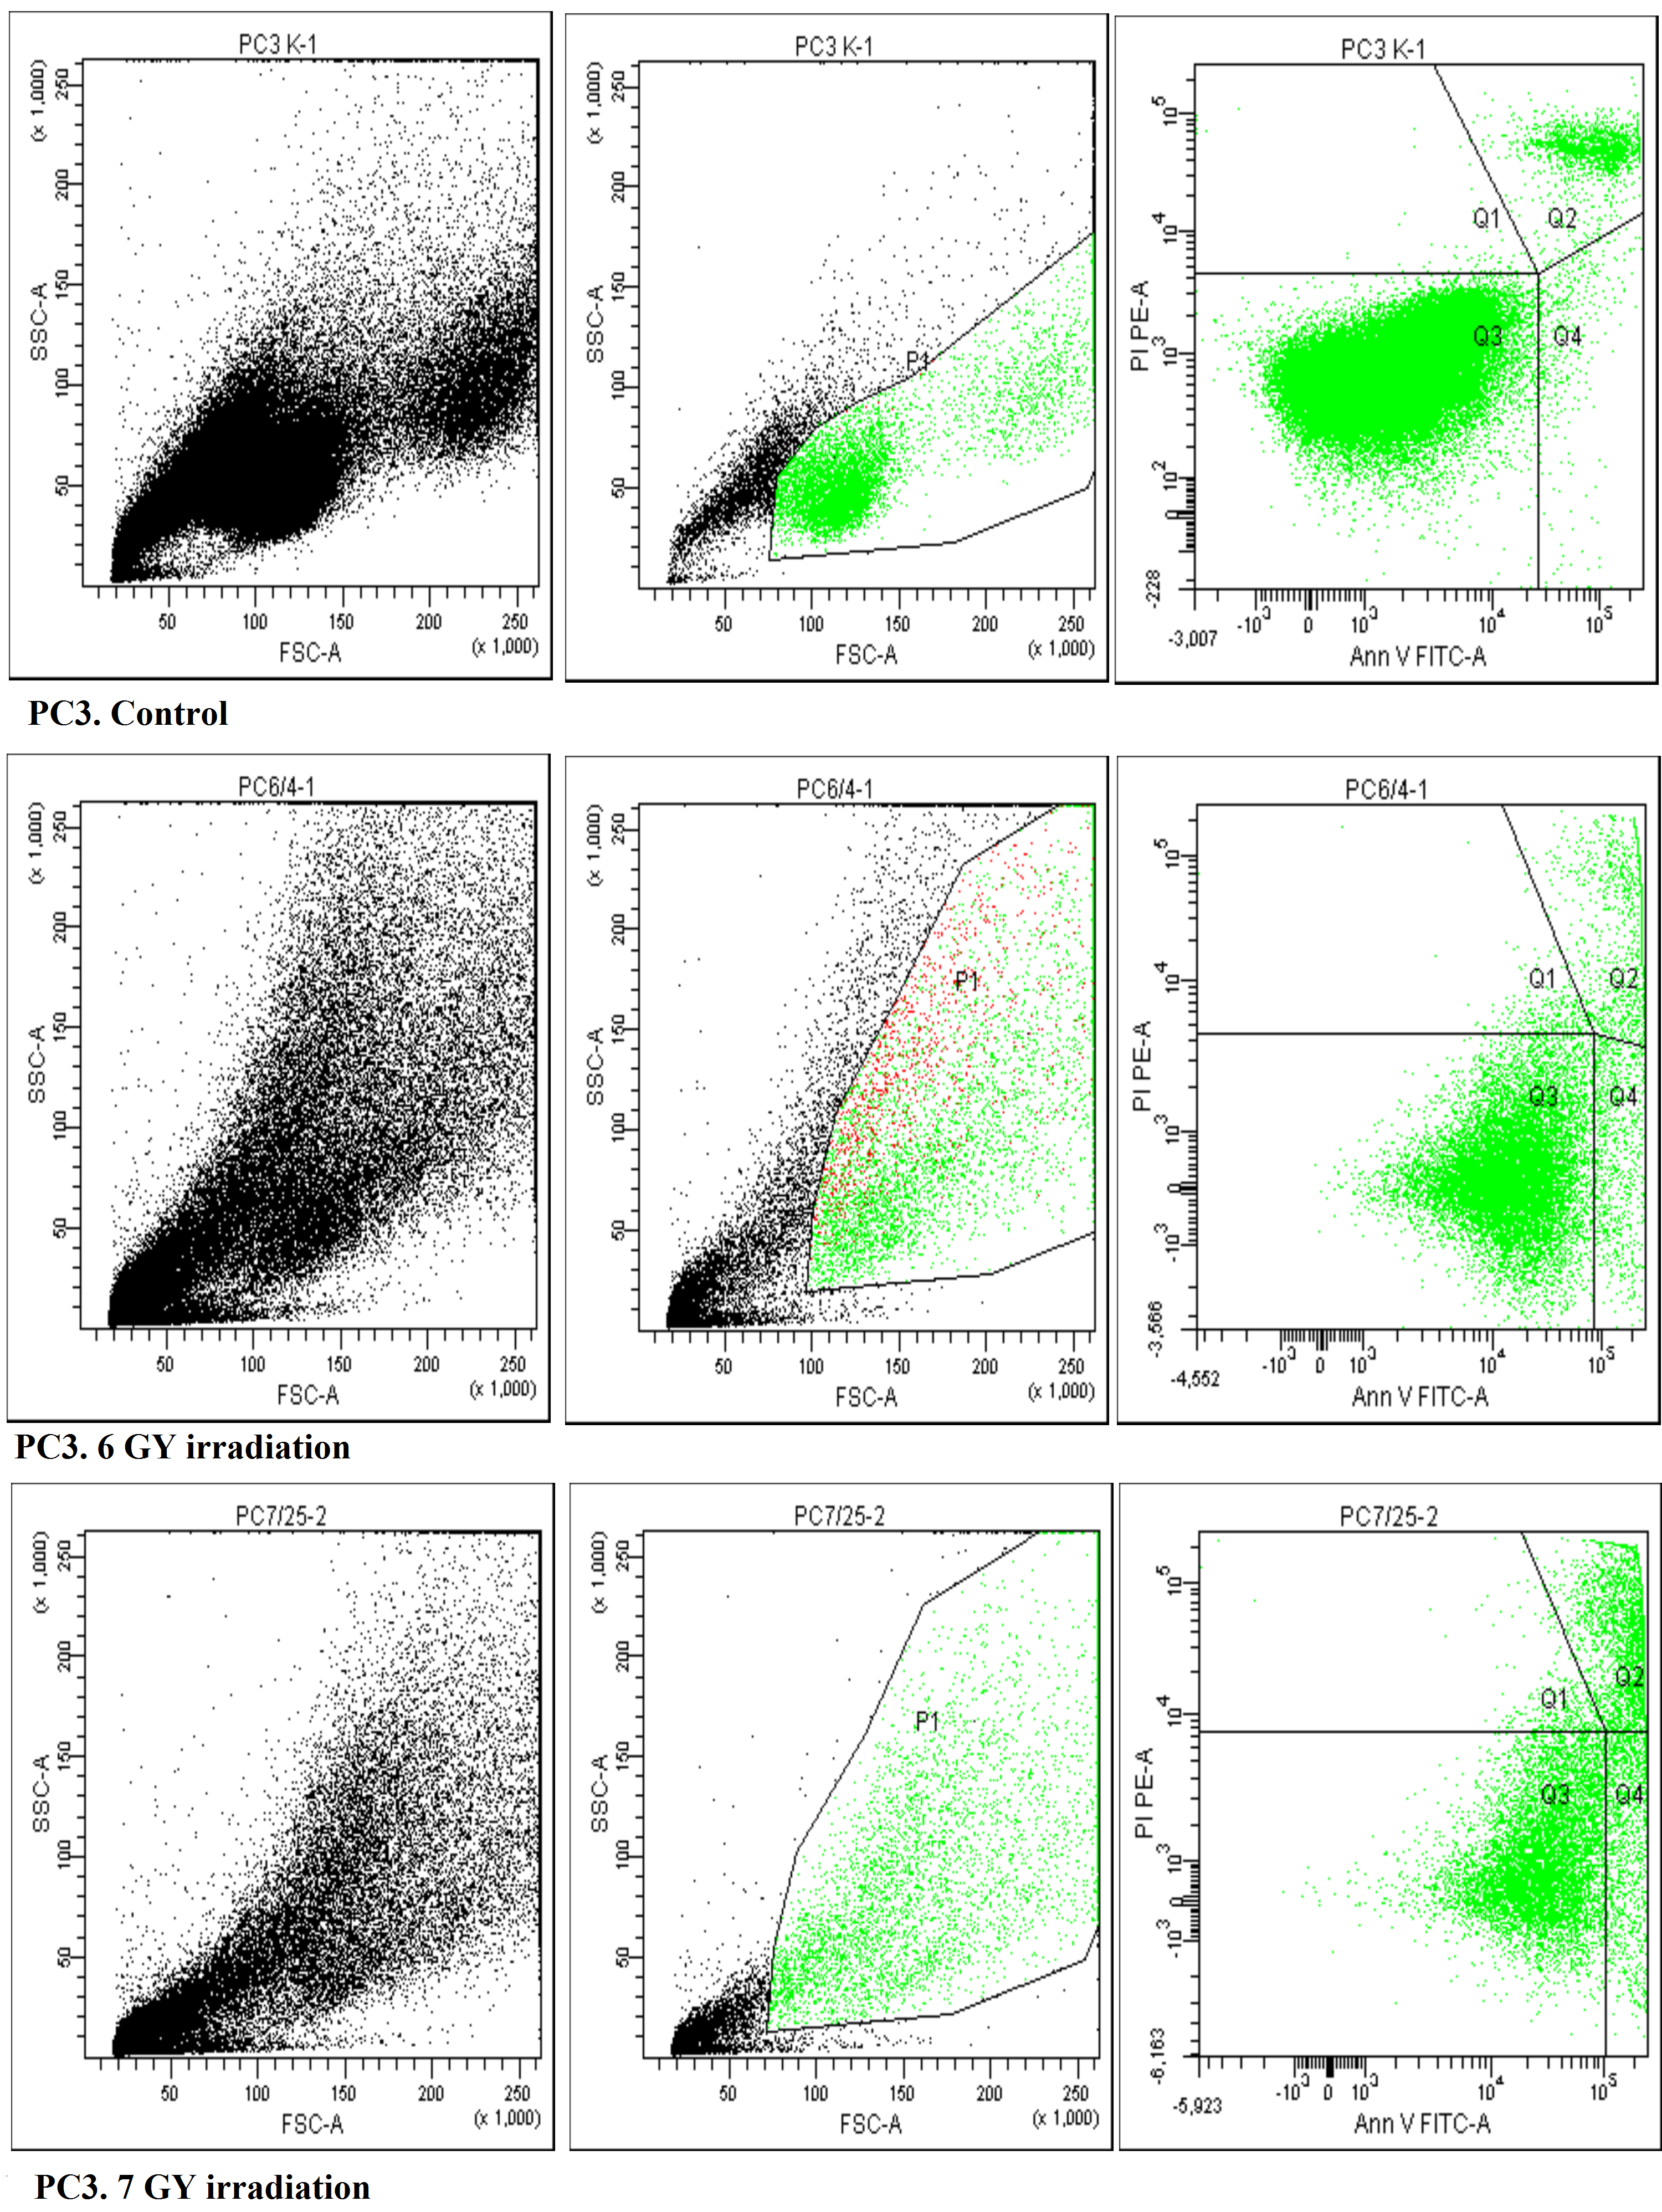
Fig. 3. The results of assessing the level of apoptosis of PC-3 culture cells after 5-day irradiation with various modes (data from a flow cytometer).
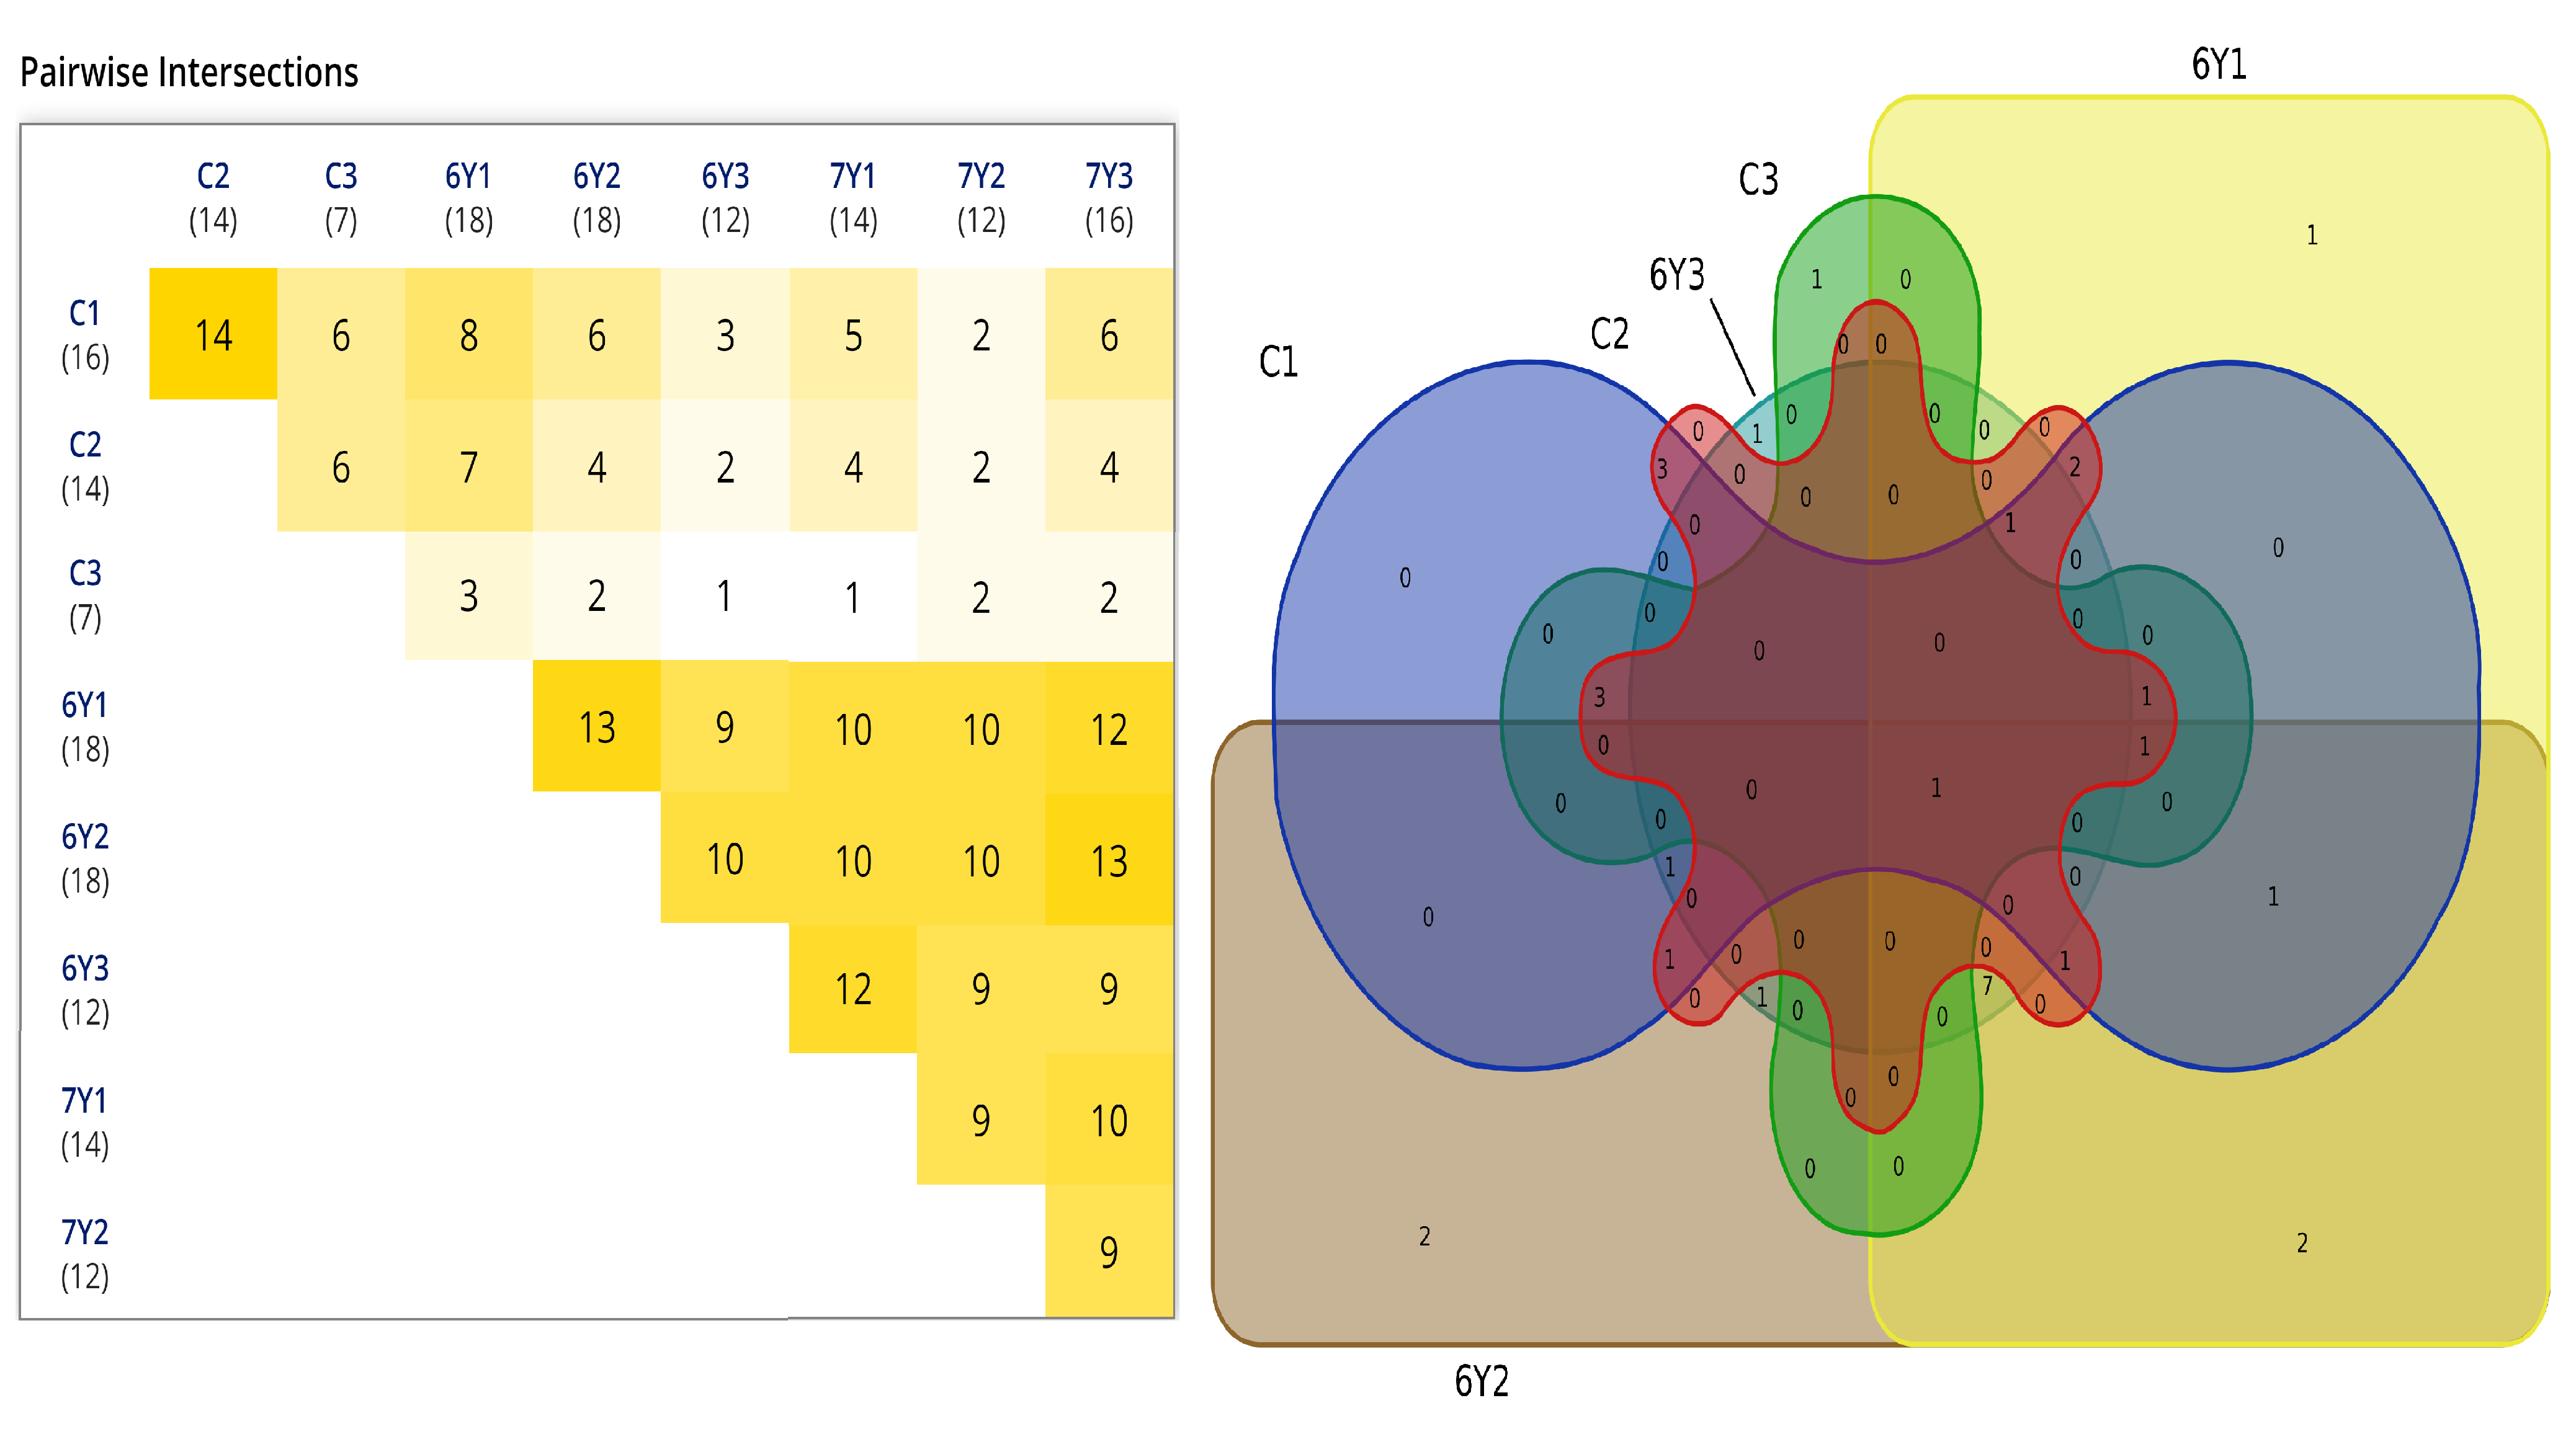
Fig. 5. Edwards-Venn diagram. The diagram shows the similarity in the number of genes with increased copy number in 9 groups – 3 controls together with 3 and 3 irradiated groups at doses of 6 and 7 Gy, respectively.
C – control, 6Y – dose of 6 Gy; 7Y – dose of 7 Gy
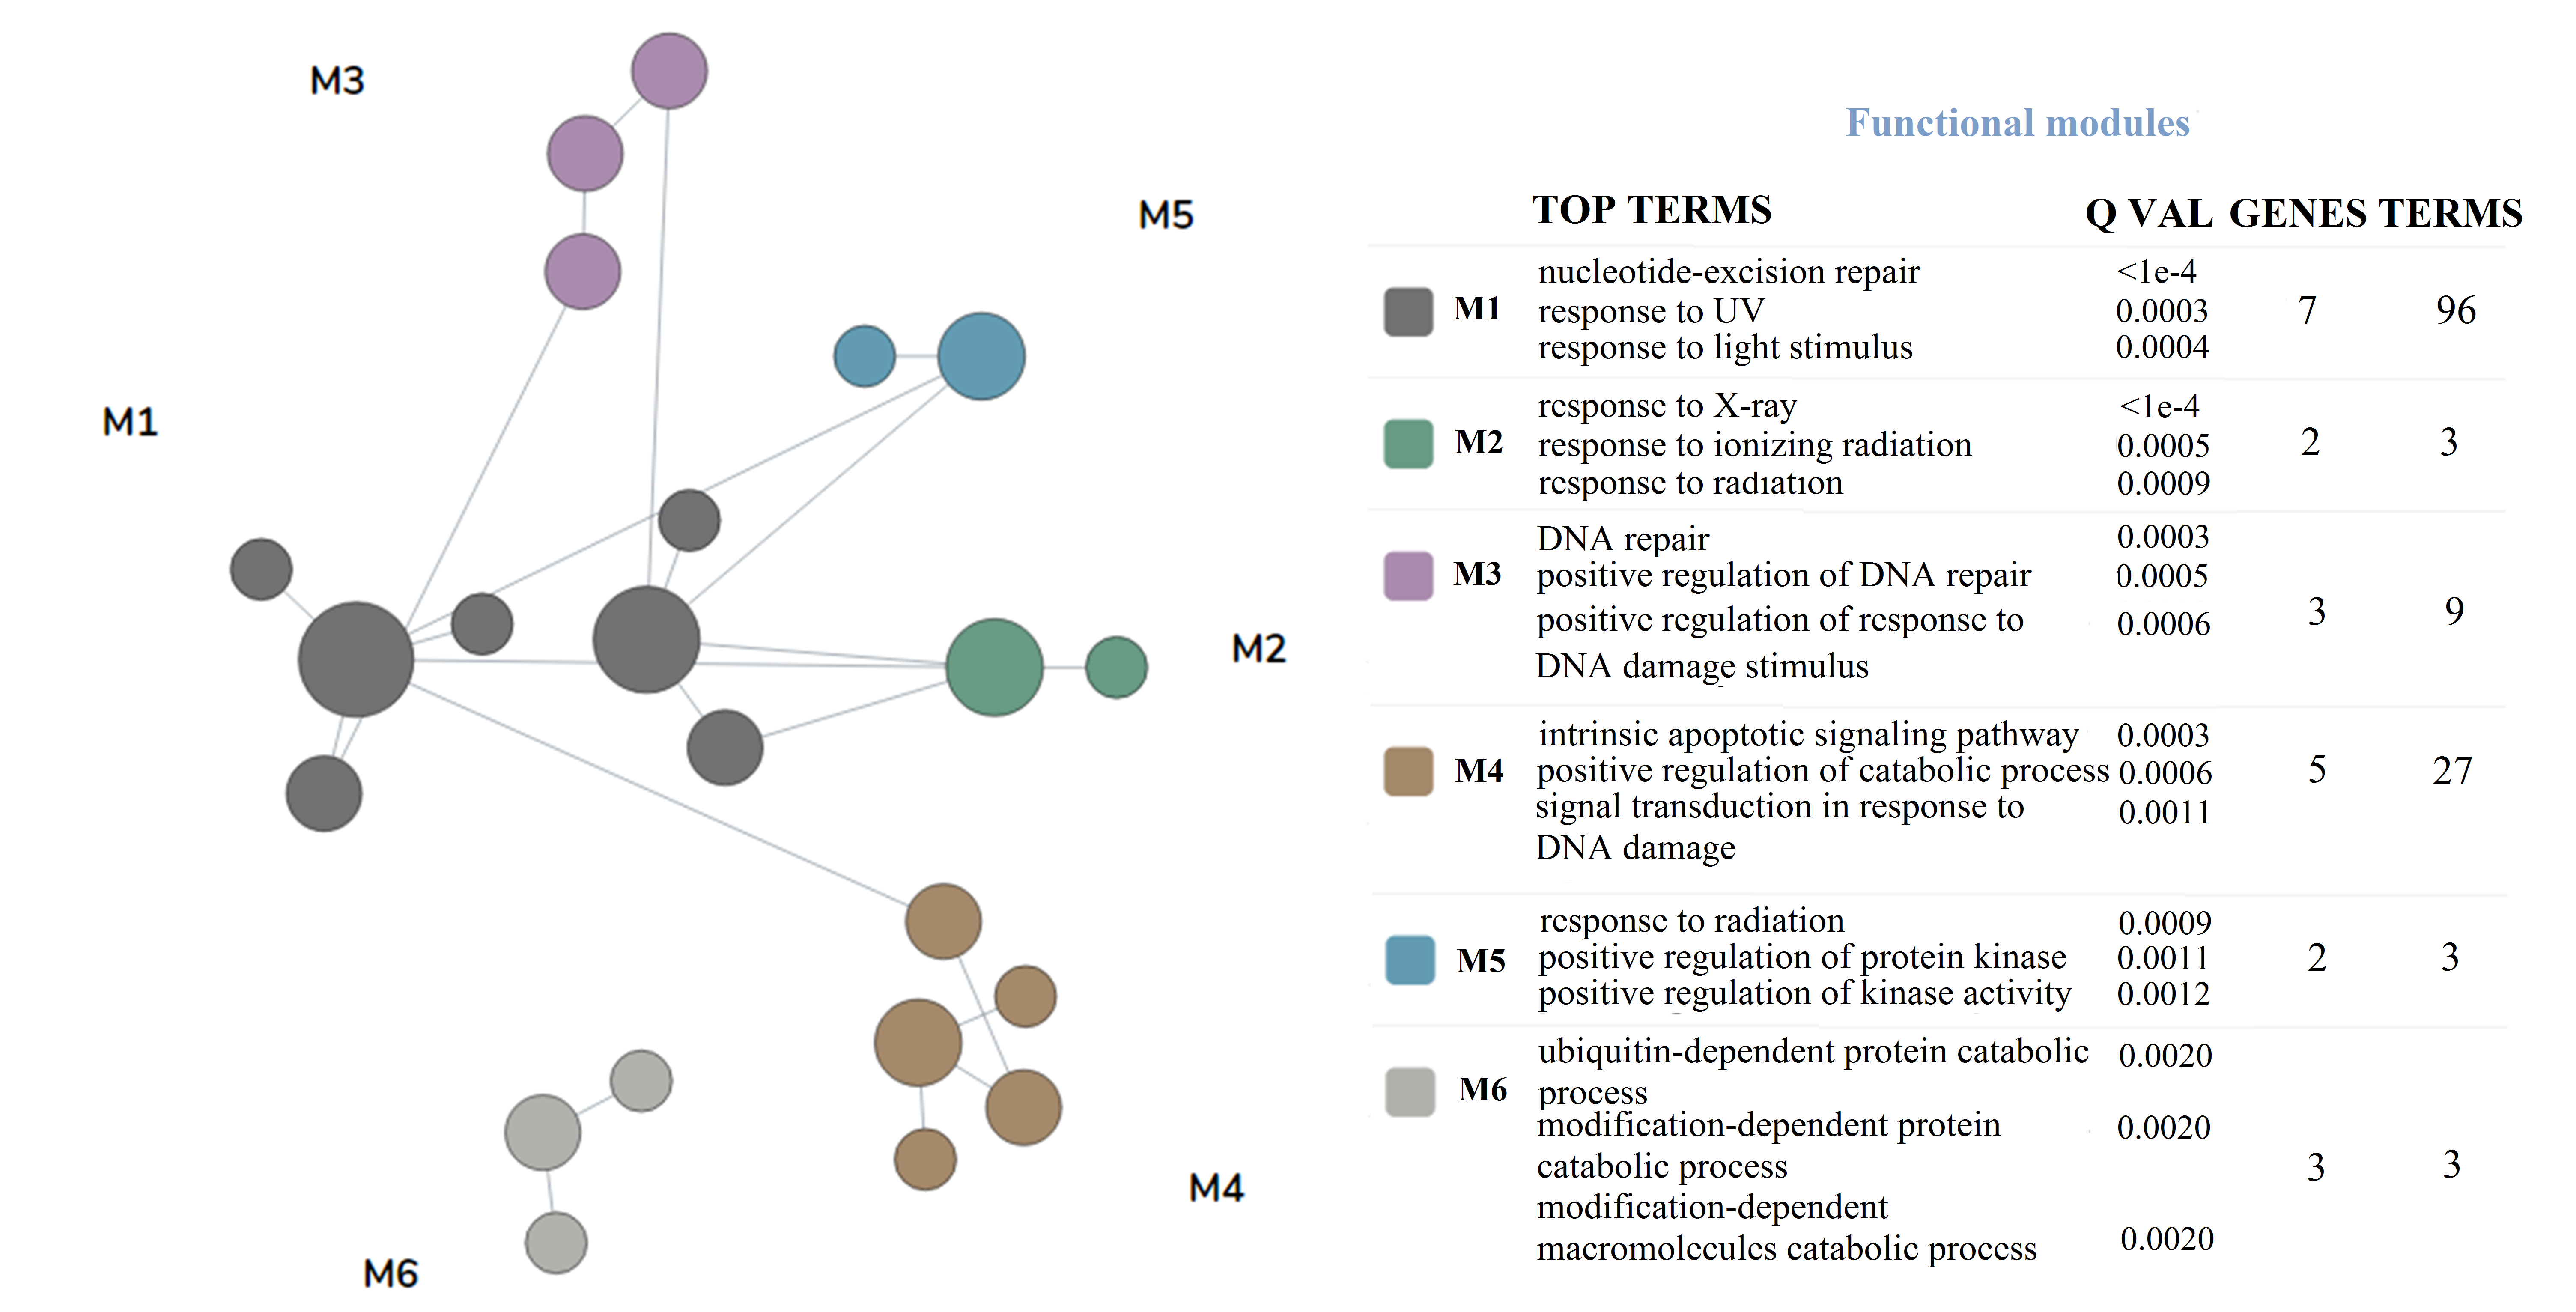
Fig. 6. Functional classification of 32 genetic loci.
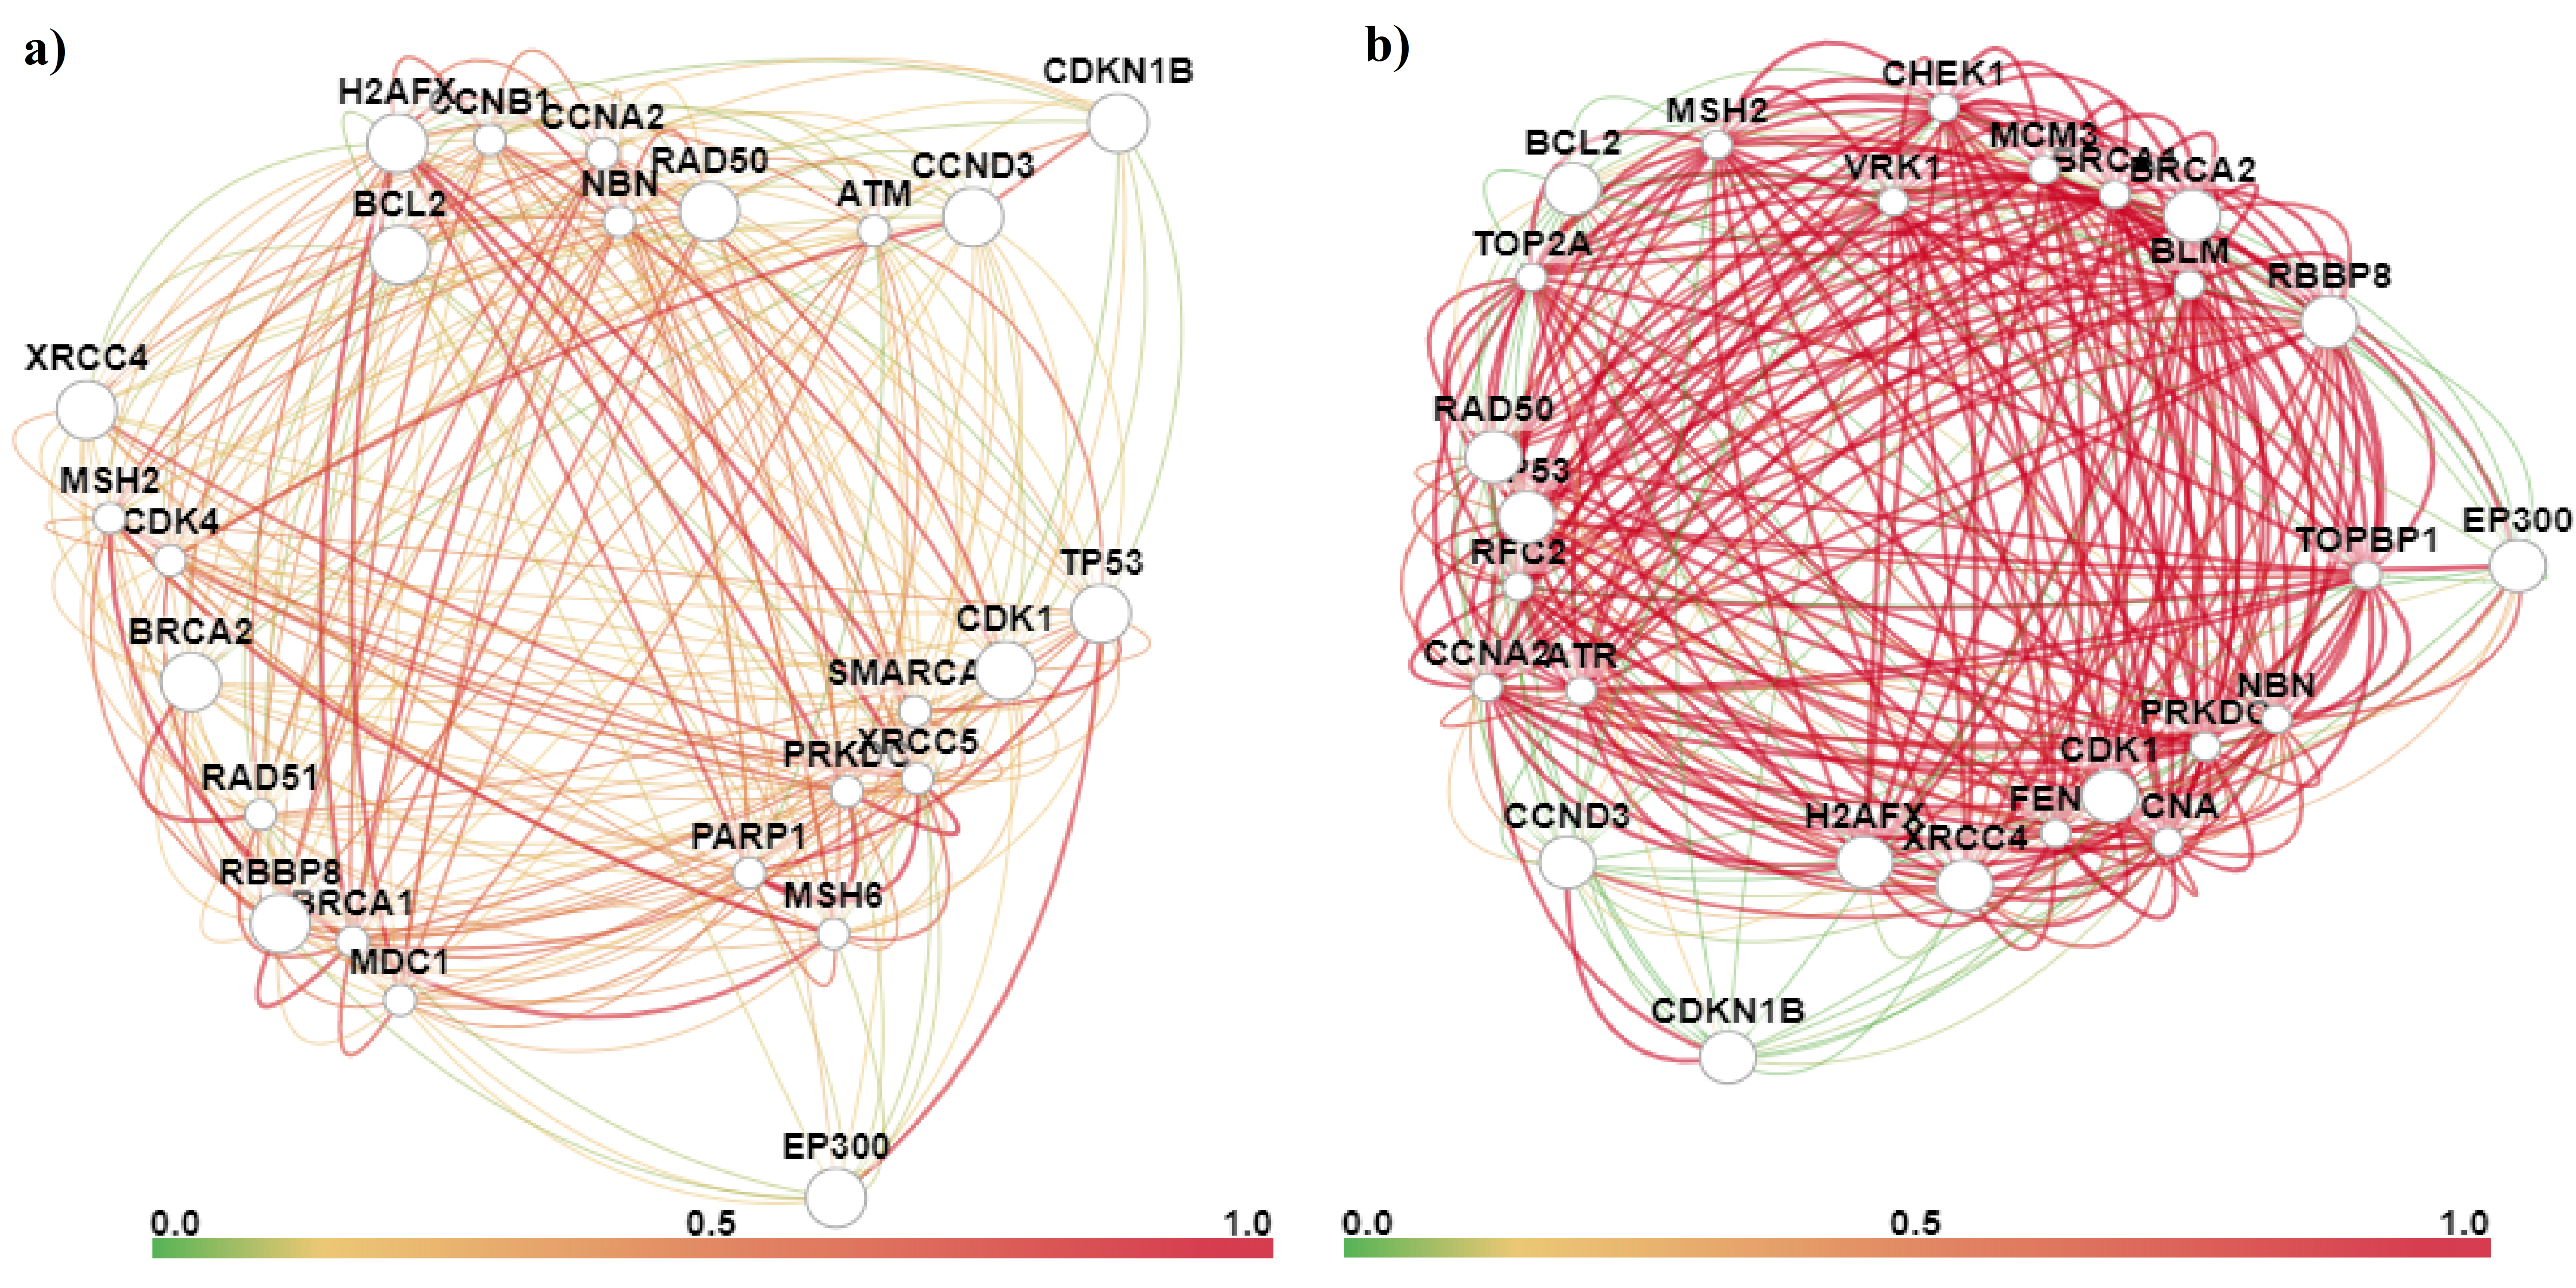
Fig. 7. Interaction network and relationship index of BCL2, BRCA2, H2AX, CASP9 and RBBP8 genes in prostate tissue (a) and in prostate tissue exposed to ionizing radiation (b). This is a network of tissue-specific genes functional interactions predicted by GIANT by combining data from full-genome experiments. Nodes represent genes, and ribs represent the predicted probability that linked genes are involved in the same biological process in tissue.
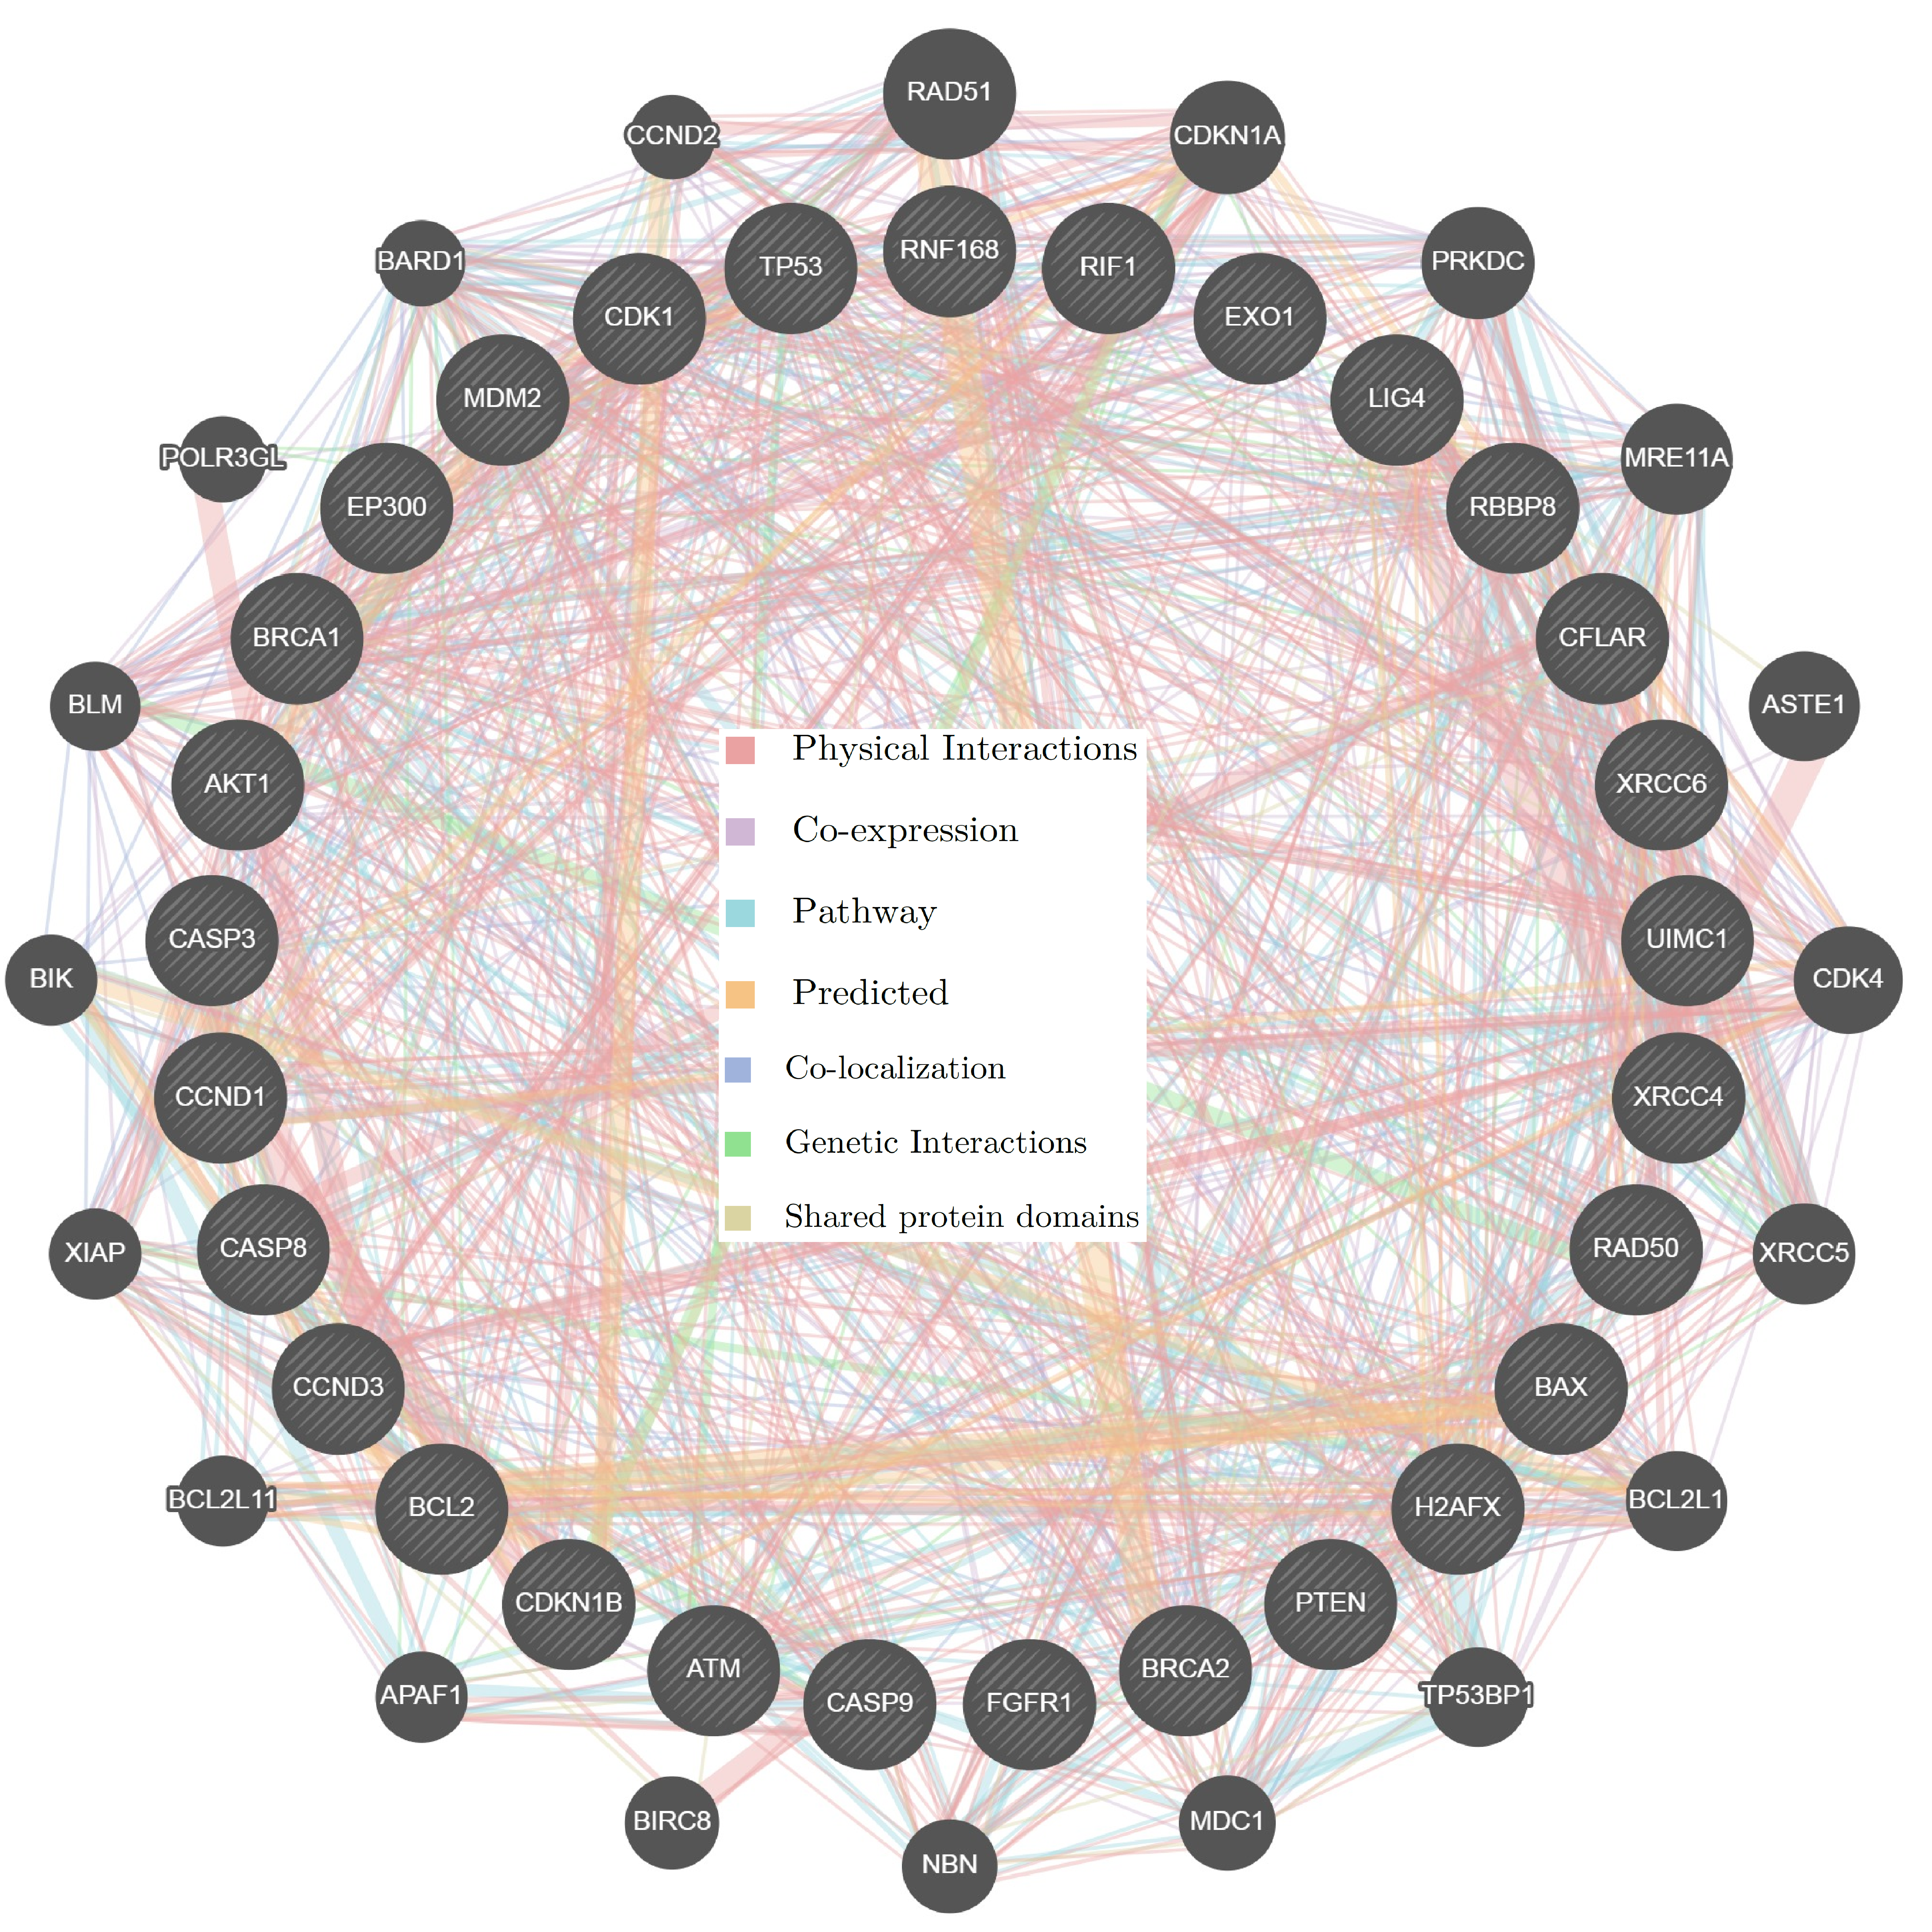
Fig. 8. Gene interactions calculated using the Multi-Association Network Integration Algorithm.