Konference: 2015 57th ASH Annual Meeting - účast ČR
Kategorie: Myelodysplastický syndrom
Téma: 637. Myelodysplastic Syndromes – Clinical Studies: Poster II
Číslo abstraktu: 2865
Autoři: MD Louise de Swart; Chloé Reiniers; Tim Bagguley; MD David Bowen, Ph.D.; prof. MUDr. Jaroslav Čermák, CSc.; MD Eva Hellström-Lindberg; MD Aurelia Tatic; Dr. Argyris Symeonidis, Ph.D.; MD Gerwin A Huls, PhD; M.D. Panagiotis Panagiotidis; Hege Garelius; Dr. Dominic Culligan; Prof. MUDr. Marta Krejčí, Ph.D.; Corine van Marrewijk, PhD; Jackie Droste; Alexandra Smith; MD Dorine W. Swinkels, Ph.D.; MD Theo de Witte, PhD
Background: The EUMDS registry collects prospective observational data on lower-risk MDS patients from 142 centers in 17 countries. Red blood cell (RBC) transfusions remain one of the cornerstones in supportive care. Patients are prone to iron overload due to long-term iron accumulation either caused by RBC transfusions or ineffective erythropoiesis and associated iron toxicity through the formation of toxic iron species.
Methods: We analyzed serum from 100 lower-risk MDS patients at six-month intervals for ferritin, transferrin saturation (TSAT), hepcidin-25, and toxic iron species (non-transferrin bound iron (NTBI) and labile plasma iron (LPI)) in order to evaluate temporal changes in iron metabolism and presence of potentially toxic forms of iron and their impact on survival.
Results: The median age was 73 years (range 44-95 years). WHO2001 MDS-subtypes were RCMD (37%), RARS (30%), RA (18%), RAEB (7%), 5q-syndrome (4%) and RCMD-RS (4%). The table shows iron parameters at registration, 1 and 2 years follow-up both in transfusion-dependent (TD) and transfusion-independent (TI) patients and according to: MDS-RS (RARS/RCMD-RS) or MDS Other (RA/RCMD/RAEB/5q-syndrome).
Serum ferritin levels were increased in TD patients, compared to TI patients. Ferritin correlated significantly with hepcidin-25 (r=0.57, p<0.001) as well as CRP (r=0.27, p<0.001). Hepcidin-25 levels were elevated in TD patients at registration and remained elevated during follow-up (Table 1). Hepcidin levels were low in MDS-RS TI patients at all time points compared to nonRS MDS patients (Table 1).
NTBI levels were elevated in TD patients compared to TI patients at registration and during follow-up. Also TI MDS-RS patients had NTBI levels above the lower limit of detection (LLOD; 0.47 µmol/L). NTBI levels over time were highest in TD MDS-RS patients.
LPI levels were mainly increased above LLOD (0.21 µmol/L) in patients with high TSAT levels (>80%). Both NTBI and LPI had a stronger association with TSAT (Figure 1AC) compared to ferritin (Figure 1BD). Elevated LPI levels in combination with high TSAT levels (>80%) occurred almost exclusively in patients with MDS-RS and/or previous transfusions (Figure 1AC).
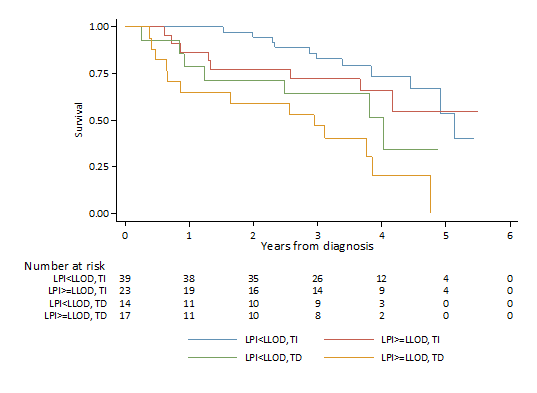
Cox regression analysis for overall survival was adjusted for age at diagnosis, cumulative number of transfused units and TSAT, NTBI or LPI respectively as a time varying covariate. LPI showed a negative impact on overall survival (HR 1.97; 95%CI 0.39-9.92), independent of transfusion status (Figure 2), while NTBI and TSAT did not show relevant impact on overall survival (HR 1.04; 95% 0.91-1.20; HR 1.00; 95%CI 0.99-1.02, respectively).
Conclusion: This is the first clinical outcome study which illustrates LPI as a clinically relevant assay format for identification of the toxic fraction of overt iron overload and its negative impact on overall survival.
Table 1: Ferritin, Hepcidin-25, NTBI, LPI during follow-up
|
Iron parameter |
|
Registration |
|
1 yr follow-up |
|
2 yrs follow-up |
|
|
N |
Median (p25-p75) |
N |
Median (p25-p75) |
N |
Median (p25-p75) |
|
Ferritin (µg/L) MDS Other: TI MDS Other: TD MDS-RS: TI MDS-RS: TD |
94 51 13 26 4 |
274.0 (131.0 – 546.0) 188.0 (81.2 - 375.0) 408.0 (272.0 - 665.0) 271.5 (160.0 - 580.0) 947.5 (359.0 - 1333.5) |
82 34 22 20 6 |
290.5 (149.0 – 845.0) 164.5 (78.3 - 293.0) 837.0 (550.0 - 1538.0) 257.0 (189.5 - 557.5) 1354.0 (859.0 - 2217.0) |
64 28 15 11 10 |
346.5 (185.5 – 723.5) 204.5 (86.5 - 346.5) 642.0 (264.0 - 1970.0) 357.0 (222.0 - 597.0) 846.0 (590.0 - 1922.0) |
|
Hepcidin (nmol/L) MDS Other: TI MDS Other: TD MDS-RS: TI MDS-RS: TD |
93 51 13 25 4 |
4.5 (2.7 – 8.4) 4.4 (2.7 - 8.3) 9.6 (4.5 - 26.3) 3.5 (1.5 - 4.9) 10.4 (7.9 - 13.5) |
82 34 22 20 6 |
5.7 (2.7 – 12.7) 5.0 (2.3 - 8.1) 17.4 (10.2 - 23.7) 3.6 (1.7 - 5.0) 9.4 (8.8 - 14.4) |
64 28 15 11 10 |
5.1 (2.5 – 8.9) 4.6 (2.5 - 7.1) 8.1 (2.4 - 12.8) 2.9 (1.3 - 6.1) 5.3 (2.9 - 9.3) |
|
NTBI (µmol/L) 0 RBC units <=10 RBC units >10 RBC units |
91 78 12 1 |
0.65 (0.31 - 1.14) 0.58 (0.30 - 1.13) 0.94 (0.40 - 3.12) 0.81 (0.81 - 0.81) |
76 52 12 12 |
0.57 (0.20 - 1.43) 0.53 (0.19 - 0.84) 0.58 (0.16 - 1.32) 2.97 (0.50 - 3.77) |
60 39 14 7 |
0.62 (0.33 - 2.27) 0.52 (0.33 - 1.05) 1.64 (0.39 - 2.27) 3.31 (1.35 - 7.25) |
|
LPI (µmol/L) 0 RBC units <=10 RBC units >10 RBC units |
91 78 12 1 |
0.13 (0.06 - 0.18) 0.13 (0.06 - 0.18) 0.13 (0.04 - 0.18) 0.13 (0.13 - 0.13) |
76 52 12 12 |
0.12 (0.05 - 0.18) 0.11 (0.04 - 0.16) 0.07 (0.04 - 0.18) 0.20 (0.15 - 0.34) |
60 39 14 7 |
0.10 (0.06 - 0.17) 0.10 (0.06 - 0.16) 0.11 (0.08 - 0.16) 0.18 (0.04 - 1.08) |
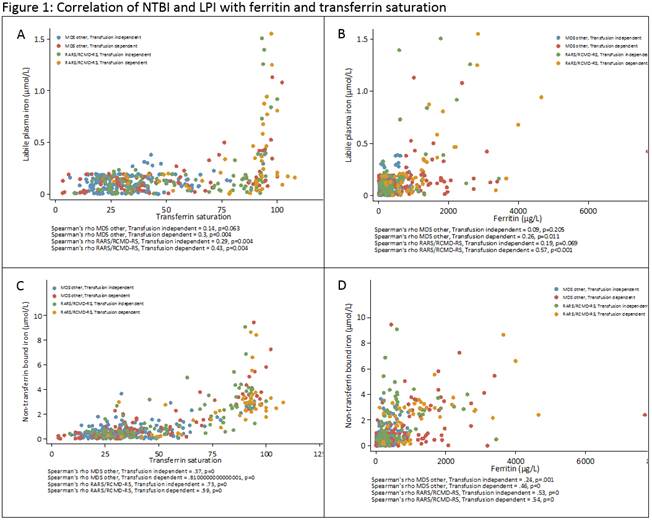
Figure 2: Impact of LPI on survival stratified by transfusion status (landmark analysis)
Datum přednesení příspěvku: 6. 12. 2015